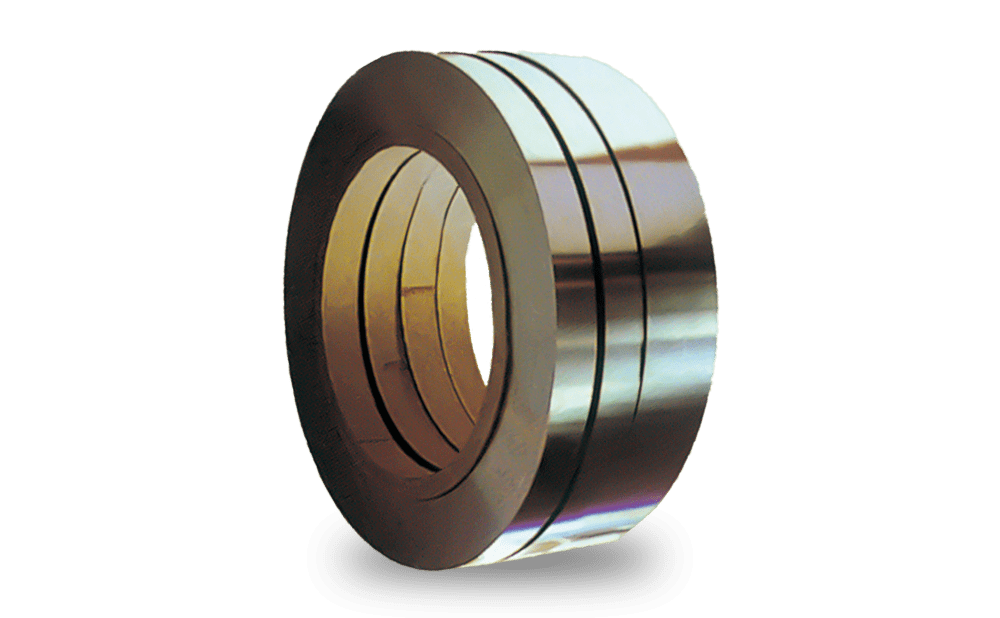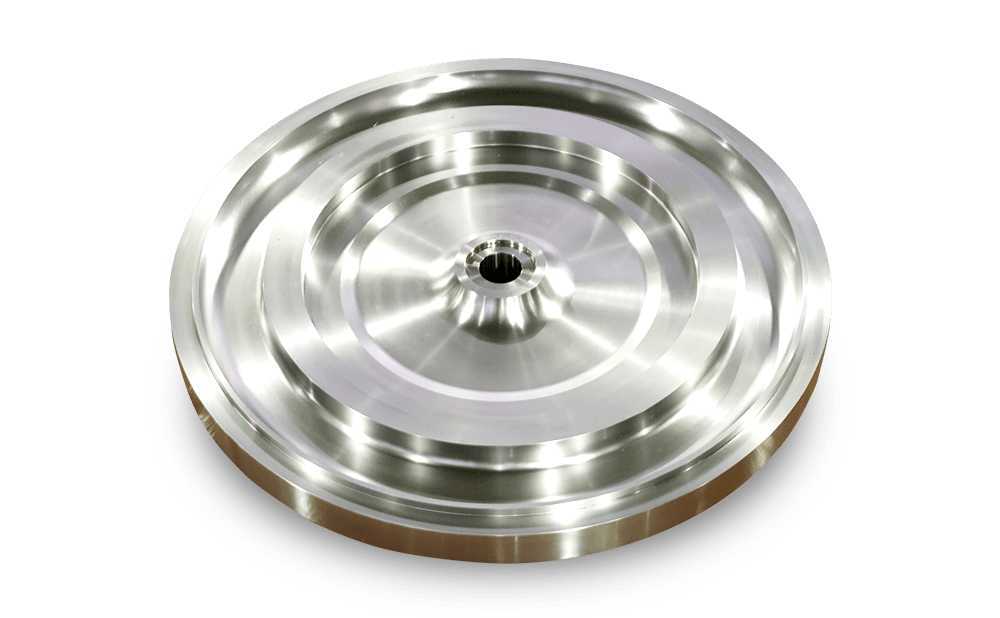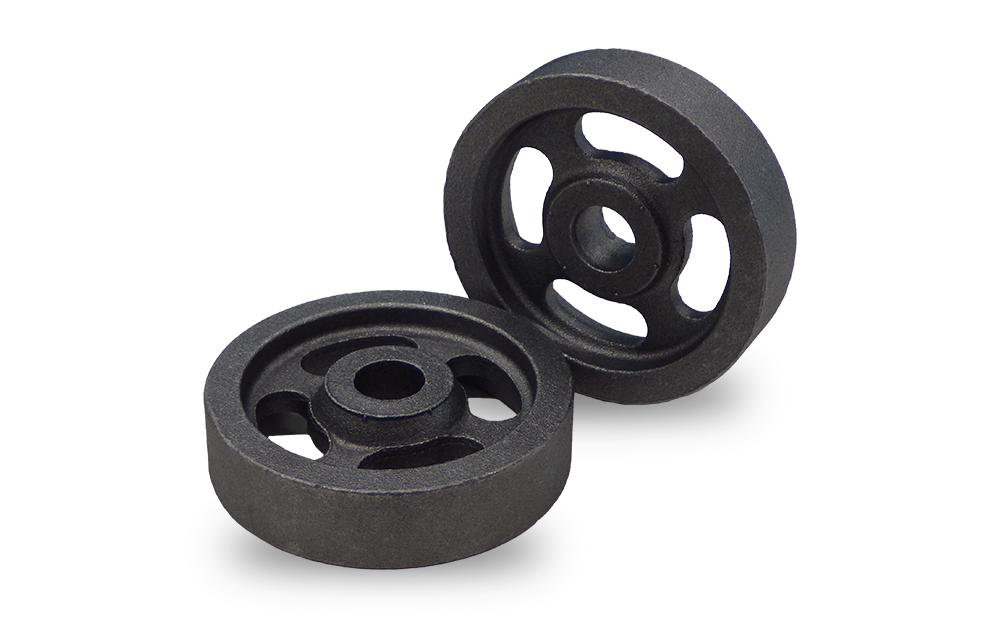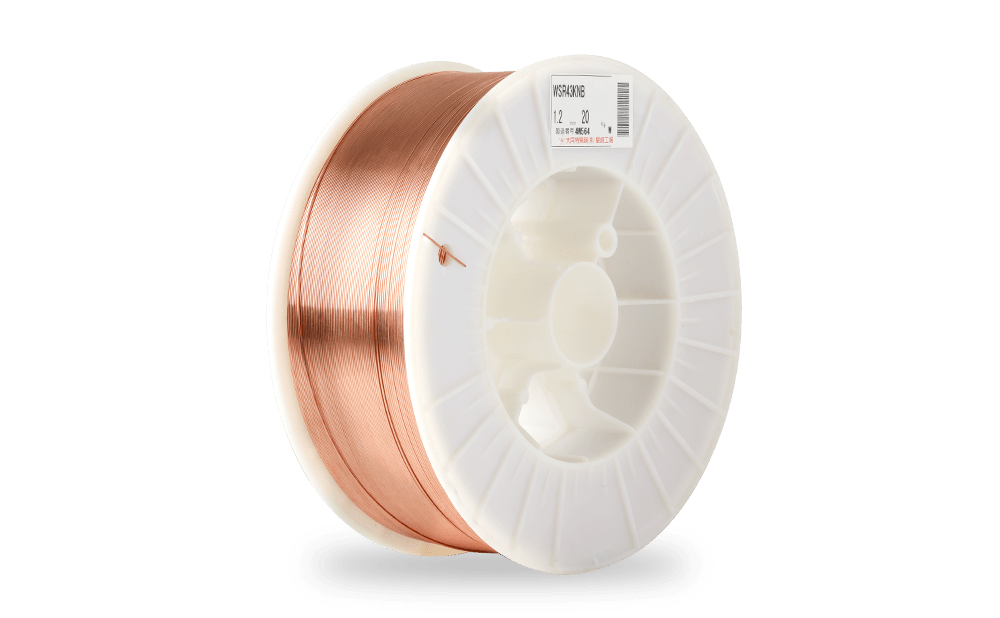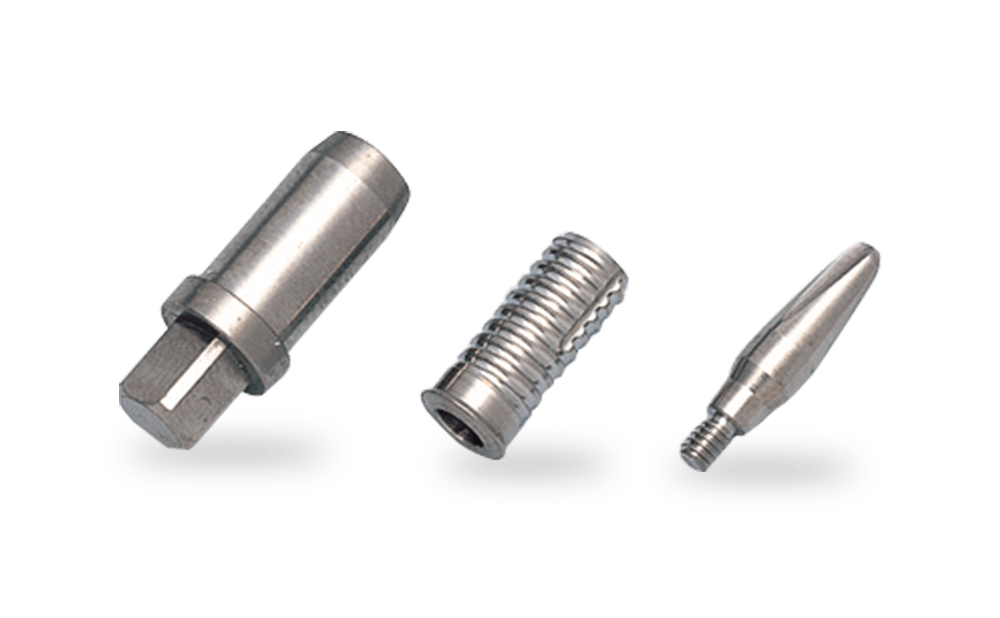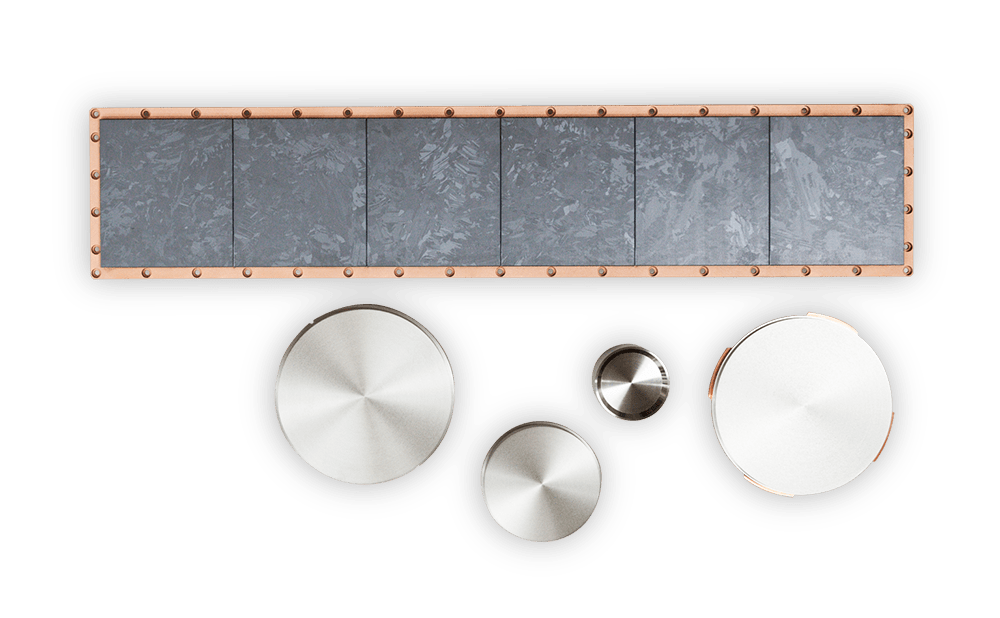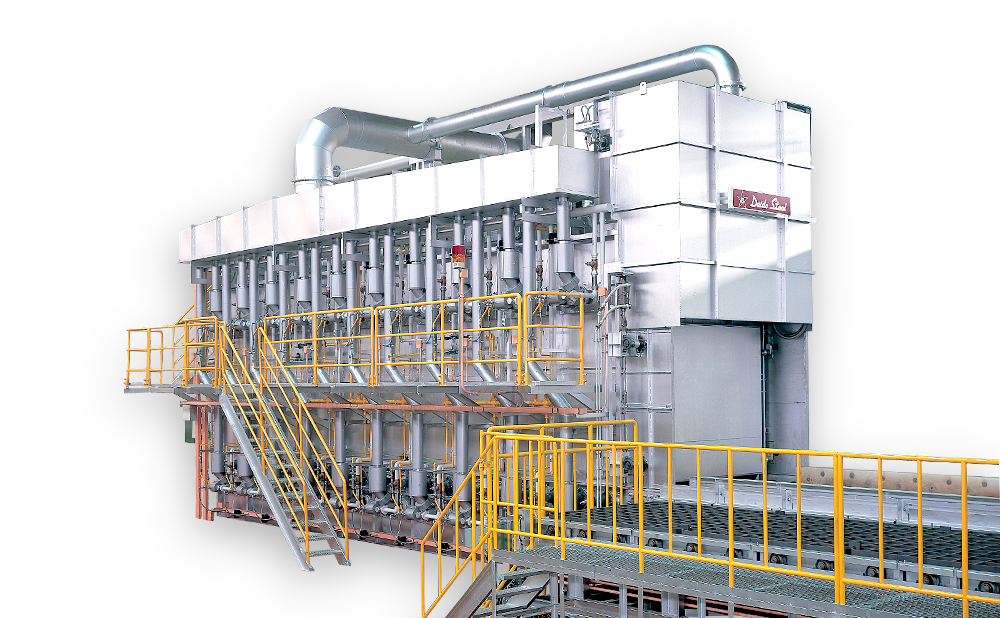
Materials for Semiconductor Manufacturing Equipment:CLEANSTAR® Series
Features, Lineup, and Chemical Composition
These materials have high cleanliness within the chemical composition range of JIS SUS316L.
We offer three types in our lineup: CLEANSTAR-A, CLEANSTAR-B, and CLEANSTAR-C, each characterized by differences in manufacturing methods, composition, and cost.
They also comply with SUS316L standards (SEMI F20) as defined by the international SEMI standards for semiconductor manufacturing equipment.
| Melting Process | Examples of Main Chemical Composition (mass%) | ||||||
|---|---|---|---|---|---|---|---|
| C | Mn | S | Ni | Cr | Mo | ||
| JISG4303 SUS316L |
- | ≦ 0.030 |
≦ 2.00 |
≦ 0.030 |
12.00~ 15.00 |
16.00~ 18.00 |
2.00~ 3.00 |
| General 316L | EAF,AOD | 0.015 | 1.84 | 0.017 | 12.1 | 16.7 | 2.02 |
| CLEANSTAR-A | VIM-VAR | 0.006 | Ultra-Low | Ultra-Low | 14.7 | 16.7 | 2.23 |
| CLEANSTAR-B | EAF,AOD-VAR | 0.007 | Low | Ultra-Low | 14.7 | 16.7 | 2.23 |
| CLEANSTAR-C | EAF,AOD | 0.012 | Low | Low | 12.1 | 16.7 | 2.02 |
CLEANSTAR-A suppresses the generation of [Mn] fumes during welding by reducing [Mn] to extremely low levels, while achieving ultra high cleanliness through extremely low [S] content and special melting processes.
CLEANSTAR-B achieves ultra-high cleanliness through extremely low [S] content and special melting processes, providing a cost advantage when extremely low [Mn] levels are not required.
CLEANSTAR-C is air melted, but it achieves higher cleanliness compared to general 316L.
Cleanliness (example – the test results of nonmetallic inclusion)
Note:The following results are representative values, not guaranteed values.
| ASTM E45 | A | B | C | D | ||||
|---|---|---|---|---|---|---|---|---|
| Thin | Heavy | Thin | Heavy | Thin | Heavy | Thin | Heavy | |
| General 316L | 2.5 | 1.5 | 1.0 | 0 | 1.0 | 1.0 | 1.5 | 0.5 |
| CLEANSTAR-A | 0 | 0 | 0 | 0 | 0 | 0 | 0.5 | 0 |
| CLEANSTAR-B | 0 | 0 | 0.5 | 0 | 1.0 | 1.0 | 1.0 | 0 |
| CLEANSTAR-C | 0 | 0 | 0.5 | 0 | 1.0 | 1.0 | 1.5 | 0.5 |
Corrosion Resistance
General Corrosion (Comparison of Corrosion Weight Loss)
Note:The following results are representative values, not guaranteed values.
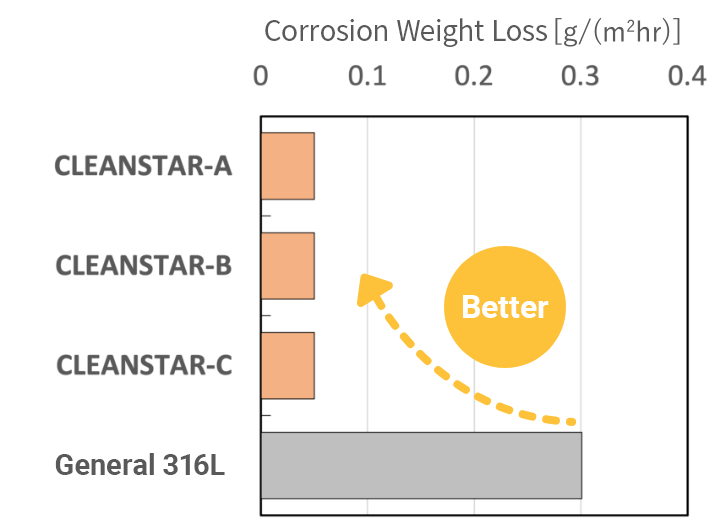
- Method:Immersion test
- Solution:1% HCl aq.
- Temp:298K
- Time:6 hrs
Pitting Corrosion (Comparison of Corrosion Weight Loss)
Note:The following results are representative values, not guaranteed values.
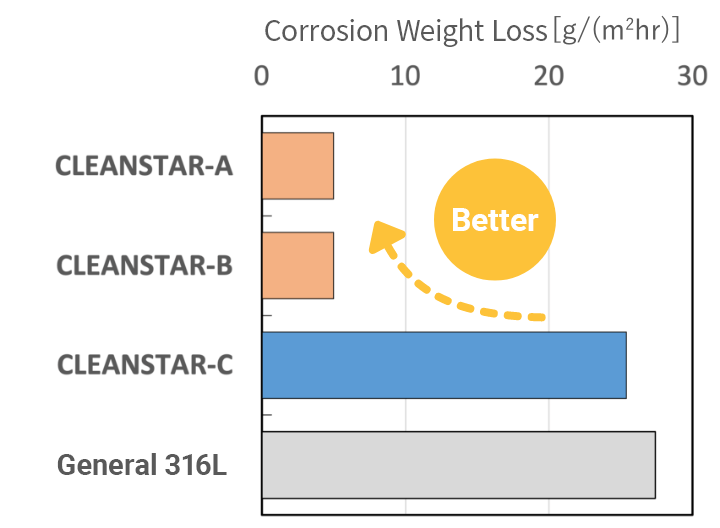
- Method:Immersion test (ASTM G48-A)
- Solution:Ferric Chloride aq.
- Temp:308K
- Time:24 hrs
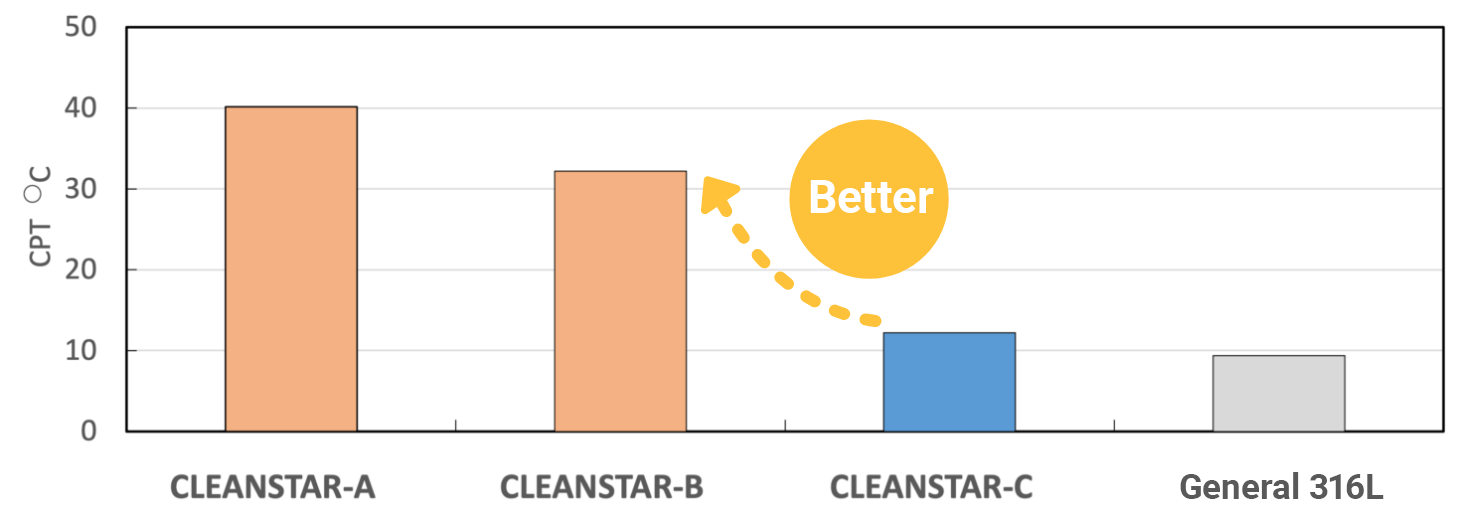
CPT:Critical Pitting Temperature
Note:The following results are representative values, not guaranteed values.
EP (Electropolishing) and Passivation Quality
Note:The following results are representative values, not guaranteed values.
| Standard | Process | Item | SEMI F19 | CLEANSTAR | General SUS316L |
||||
|---|---|---|---|---|---|---|---|---|---|
| HP Grade |
UHP Grade |
A | B | C | |||||
| SEMI F37 | After EP | Surface Roughness |
Ra Ave. (μin) | ≦10 | ≦5 | 1.2 | 1.2 | 1.2 | 1.2 |
| Ra Max. (μin) | ≦15 | ≦10 | 1.2 | 1.2 | 1.2 | 1.2 | |||
| Ry Max. (μin) | ≦150 | ≦100 | 6.7 | 7.5 | 7.9 | 9.4 | |||
| SEMI F60 | After Passivation |
Surface Composition |
Cr/Fe | ≧1.0 | ≧1.5 | 1.8 | 2.0 | 1.8 | 1.9 |
| CrOx/FeOx | ≧1.0 | ≧2.0 | 3.0 | 3.3 | 2.9 | 2.9 | |||
| SEMI F73 | Surface Defect |
Average | ≦30 | ≦10 | 1 | 1 | 7 | 11 | |
| Max | ≦50 | ≦20 | 8 | 7 | 13 | 22 | |||